To illustrate the drawing of rounded points and colouring and texturing, this lecture provides an example of rendering the earth with an animated temperature anomaly overlay.
The webpage is developed in the following steps:
Press F12 in your browser to view the source behind each step. The final result is in the following section. It includes animation of the overlay texture and combination of the WebGL canvas with text written in a 2D canvas (Head Up Display, see the third subsection of Chapter 10 in GL).
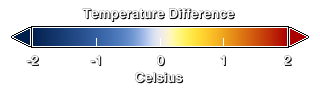
Temperature anomalies computed by NASA and others relative to the base period 1951-1980.
|
Mouse control: orbit - left button, zoom - middle button, pan - right button.